About this

Writings so far

10.11.2013

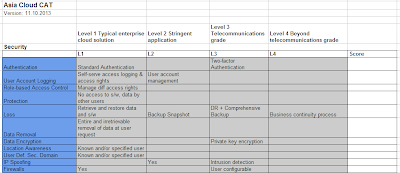
Asia Cloud Computing Association Cloud Assessment Tool - benchmark table

Based on the ACCA CAT I've put the performance categories and associated service levels into a easy to user table, that gives a "one-page" overview of the CAT, that in turn can be used for CAT benchmarking and presentations.


10.09.2013

Asia Cloud Computing Association Cloud Assessment Tool

Earlier this year, the Asia Cloud Computing Association (ACCA) released a Cloud Assessment Tool (CAT) that can be used to benchmark and compare different cloud providers, geared mostly towards the operational performance side of cloud IT service delivery.

An online version is available at the www.asiacloud.org site.

Benchmarking and comparing any IT service delivery or performance is tricky, be it for corporate IT or cloud based service delivery, but the ACCA CAT provides a valuable tool and framework to help companies evaluate not only cloud service providers and offerings, but also data center providers, hosters and online service providers in general.

Short overview of the CAT:

The CAT is is organised into eight performance categories spread over four service tiers, with the performance categories being

  • Security: Privacy, information security, regulatory
  • Life Cycle: Long-term support impacting customer business processes
  • Performance: Runtime behavior of deployed application software
  • Access: Connectivity between the end user and cloud service provider
  • Data Center: Data Center physical infrastructure
  • Certification: Degree of quality assurance to the customer
  • Support: Deployment and maintenance of applications
  • Interoperability: Cloud hypervisor interfaces to applications

The four service tiers are based on the availability or uptime classification system used by the Uptime Institute which defines 4 data center models, referred to as Tiers I-IV. Tier I defines a data center with quite basic
reliability, whereas Tier IV defines a data center having a highly redundant architecture.  Level 4 is not necessarily better than Levels 3, 2 or 1, it's more a matter of suitability to IT task or service delivery use case at hand, and whether a particular level is needed by a business unit, an application or Internet service or not. 

The service levels:
  • Level 1 Typical enterprise cloud solution
  • Level 2 Stringent application
  • Level 3 Telecommunications grade
  • Level 4 Beyond telecommunications grade

Using the online CAT, it's then quite easy to grade cloud service providers for a specific project or service delivery, and take out some of the guesswork and uncertainty when choosing a cloud service provider. The CAT can or should of course be used together with other assessment tools for choosing a cloud service provider, for instance in the areas of cost and pricing, APIs, helpdesk and support, references and functionality.


Leverhawk article: The Real Story Behind Cloud and Financial Transparency

There's a good article over at Leverhawk by Scott Bils on "The Real Story Behind Cloud and Financial Transparency" and corporate IT cost modelling and baselining versus cloud IT cost transparency.

It makes the point that corporate IT needs to expose IT cost down to the main and optional IT service elements for business IT as we now have with public cloud services, and also that corporate IT needs to switch to an periodic OPEX based cost model as cloud providers support, and not yearly CAPEX towards business units that they serve.

But in addition, the author makes the point that greater corporate IT cost transparency and move to OPEX cost model misses the bigger point, and that "the more significant impact that public cloud services have is that for the first time they expose corporate IT to the forces of market pricing."

This is of course a valid point, as it's now quite easy for internal business units now to compare internal IT costs with more or less, or increasingly better public cloud services.  Both in the areas of IT infrastructure (IaaS) and application delivery (SaaS), for instance


  • Monthly cost of corp IT storage vs public cloud storage (GB/month with different SLAs)
  • Monthly cost of server hours/month versus cloud VMs
  • Monthly cost of apps and app suites like MS Office, SAP, Oracle and MS Sharepoint vs cloud based equals

Initially it might seem that both greater cost transparency and move to OPEX based cost model for corp IT as well as baselining and benchmarking against public cloud pricing is both a good thing and key driver for corporate IT cost efficiency and staying relevant, but there's also another angle here.

Public cloud pricing for application services in the SaaS domain also exposes and threatens the software licensing + yearly support model that most software companies has relied on for the last 10-20 years.  Besides leaving out many middlemen that currently runs with the CD licensing model for software, doing on-site install, support and integrations for local installs, a cloud based delivery model also exposes the software vendors to the same pricing transparency and benchmarking opportunities that corp IT now has to live with.


10.08.2013

Towards a cloud IT utility marketplace

As noted in an earlier post, cloud IT infrastructure from different providers are rapidly being commoditized and comparable through public pricing and T&Cs: VMs rapidly approaching same-same pricing, performance and specifications, more or less the same for basic file storage and IP networking.

As an aside, commodity and IT are often used in common and thrown around when a given IT service or piece of hardware has been in the market for some time available from many providers, but as outlined by Wikipedia, "The more specific meaning of the term commodity is applied to goods only. It is used to describe a class of goods for which there is demand, but which is supplied without qualitative differentiation across a market".

So even of cloud IT services and IaaS isn't a "class of goods" in it's own right, certainly we are seeing IT services delivery demand that can be "supplied without qualitative differentiation across a market", albeit with some, over time not critical, different service and operational levels (i.e. SLAs and OLAs).

For cloud IaaS compute or processing, a growing trend seems to the development of IaaS marketplaces for CPU core or VM resources. This has come about in many ways, but some drivers to me seems to be

  • Public IaaS pricing and T&Cs coupled with partner or re-seller programs enabled the birth of cloud aggregators, that could aggregate and offer cloud IaaS services across many IaaS providers and hosters, using different providers for different use cases, regions or application sets.  Customers still had to be or were aware the underlying IaaS provider for their apps and had to go with their IaaS service provisioning workflow and set-up.
  • Another set of companies like IT monitoring, TCO/pricing, security and compliance specialists like TÜV Rheinland developed their IT service catalogs to include cost baselines for basic IT components like CPU compute, storage and networking.  These IT product catalogs with IT baseline pricing benchmarks can also be applied to cloud based IT delivery.
  • Mature companies and cloud users adopted an multi-cloud business delivery strategy to avoid one vendor lock-in.
  • IT vendors and cloud specialists developed proper cloud aggregation or marketplace service delivery platforms that made the hoster or cloud provider and the VM production platform and site in the marketplace transparent towards the cloud buyers.
  • Players from the broker, stock and derivatives market side realized cloud IT could be viewed as separate, atomized, billable utility units and are teaming up with cloud platform providers in the aggregation or marketplace area.


A special note can be made for Amazon and their dominating AWS cloud offering.  No doubt many of the cloud marketplace initiatives and offerings are established as a way to compete with Amazon AWS in terms of pricing and cloud IT feature set as currently apparently nobody is able to reach the "default cloud provider" and position of Amazon AWS (besides maybe Google).

Some early cloud IaaS "open marketplace" contenders are:
  • ComputeNext: The ComputeNext platform makes it possible to "compare cloud services and find the best cloud provider to service a given geography, while factoring in price, uptime, and other performance factors such as provisioning consistency, speed, and machine reliability", working with a range of local hosters and cloud providers.
  • Deutsche Börse Cloud Exchange (DBCE)/Zimory: DBCE is using the IaaS cloud management software of Zimory for their vendor-neutral marketplace for compute and storage capacity in 2014, targeting corporate and medium-to-large enterprise companies, as well as organizations from the public sector, aiming to make it as easy to trade IaaS capacity as it is to trade energy or stocks.
  • CME Group/6fusion Marketplace: CME Group (Chicago Mercantile Exchange Group) and one of Europe’s largest derivatives exchanges, has partnered with 6fusion, a company that specializes in the economic measurement and standardisation of IT infrastructure, to develop a spot and over-the-counter marketplace for trading computing resources and financial contracts.  And is a good example of a trading company using its electronic trading platform together with an cloud aggregation or marketplace platform.  

No doubt this is a developing market, and there are a range of players looking at early positioning and options, but for the cloud IT market and development, it's an encouraging sign that commercial market exchanges and börse's are looking to engage their trading platforms with this market area, leading to increased standardization and hopefully increased supplier choice for cloud buyers.

10.07.2013

Twitter IPO and Twitter message streams for market analytics, part 2: Twitter streams for TV analytics

An example of using Twitter message feeds for market and consumer analytics will be highlighted later on today, according to a WSJ article,  when Nielsen releases their first ranking of TV programs with the greatest reach on Twitter and will provide details on the size of TV audiences for TV shows and the number of tweets about them.

This shows some of the potential of using Twitter message streams for market analytics, where the Twitter Amplify program for content providers also looks to bring in additional Twitter and TV-shows "integrations" over time.

As pointed out in the article, there are barriers to overcome for general and large-scale use of Twitter for TV analytics; audience to small and segmented, skew between "ordinary" Nielsen TV-ratings and Twitter mentions, integration with other market data analytics tools etc, but in due time Twitter TV-mentions and trends will form part of TV programming analytics and scheduling, as well as market research. 

Short note: A Guide to ‘Going Google’ for CIO’s and Enterprise Architects

The Cloud Best Practices Network has a nice paper or guide for ‘Going Google’ for CIO’s and Enterprise Architects that provides an overview of the Google Cloud suite of products, ranging from Google Apps through Compute IaaS, Big Data services, storage and more.

10.06.2013

Twitter IPO and Twitter message streams for market analytics: The real potential of Twitter for advertisers

Twitter, which filed for an public IPO with the US Securities and Exchange Commission back in June, that didn't become public before now in September, hopes to raise $1 billion with their public IPO. The SEC S-1 documents made public, stated that Twitter had $253,6 million in revenue for first half of 2013,  with net loss at 41 percent to $69.3 million and with some 215 million monthly active users.

The current and future revenue are said to come from three main ad-based sources:


  1. Promoted tweets that appears in users message feeds
  2. Promoted accounts (i.e. brands, companies, events etc) that appears on Twitter landing pages
  3. Promoted trends, where advertisers can buy their way into trending lists, themes and developments
The Twitter "ad media universe" is somewhat limited and the advertising tools available for advertisers might seem limited as well.  But with the Twitter IPO being a confidential or "secret" IPO available for sub $1 billion companies (in revenue), all the available or future ad channels for Twitter hasn't been highlighted. To me there's one obvious one that is clearly missing (though I haven't read the full S-1 documents), and that is the big data mining and analytics opportunities with Twitter tweets and message flows for consumer tracking, audience sentiment tracking and overall market trends.

The Twitter streaming APIs gives developers or Twitter log collectors, applications or apps "low latency access to Twitter's global stream of Tweet data", either collecting all Twitter messages in a continuous stream, collecting single-user message streams or site streams . 

With more than 500 million tweets a day through Twitter, this gives market analysts, advertisers, companies and Twitter itself of course, a unique view into
  • Trending themes and developments, i.e. new phenomena of all sorts, Internet memes, things going viral, movie or TV-shows releases, new consumer brands, pop stars, new albums, books etc
  • Long-term development and standing of brands, products, product models, consumer sentiments
  • Developing news and events
  • National and regional break-downs of trends, developments and long-term standing 
  • Cross-linked with mobile or PC access, client type, time of day, frequency of tweets or mentions etc
Utilizing Twitter message streams for near real-time market analysis and consumer views should be a no-brainer for advertisers, just as Netflix used their own data analytics to create House of Cards and other TV-shows - how long before advertisers catches on?